On this page
In short
Start with the delta chart on page 2: where its line climbs, you lose time to the reference lap. The charts under it show why, and page 3 turns that into two or three things to try.
A KartDataPro report is a PDF that compares your best lap of the session with a reference lap. Page 1 sums up both laps, page 2 shows where the time goes, and page 3 is advice from an AI race engineer. Reports come in English, Spanish and Italian.
Getting your report and opening it online
The report is made automatically after a session sold with telemetry. With a KartDataPro account it arrives by email with the PDF attached; without one, it is emailed when your booking asks for results by email. The venue receives a copy too, and staff can print one at the desk.
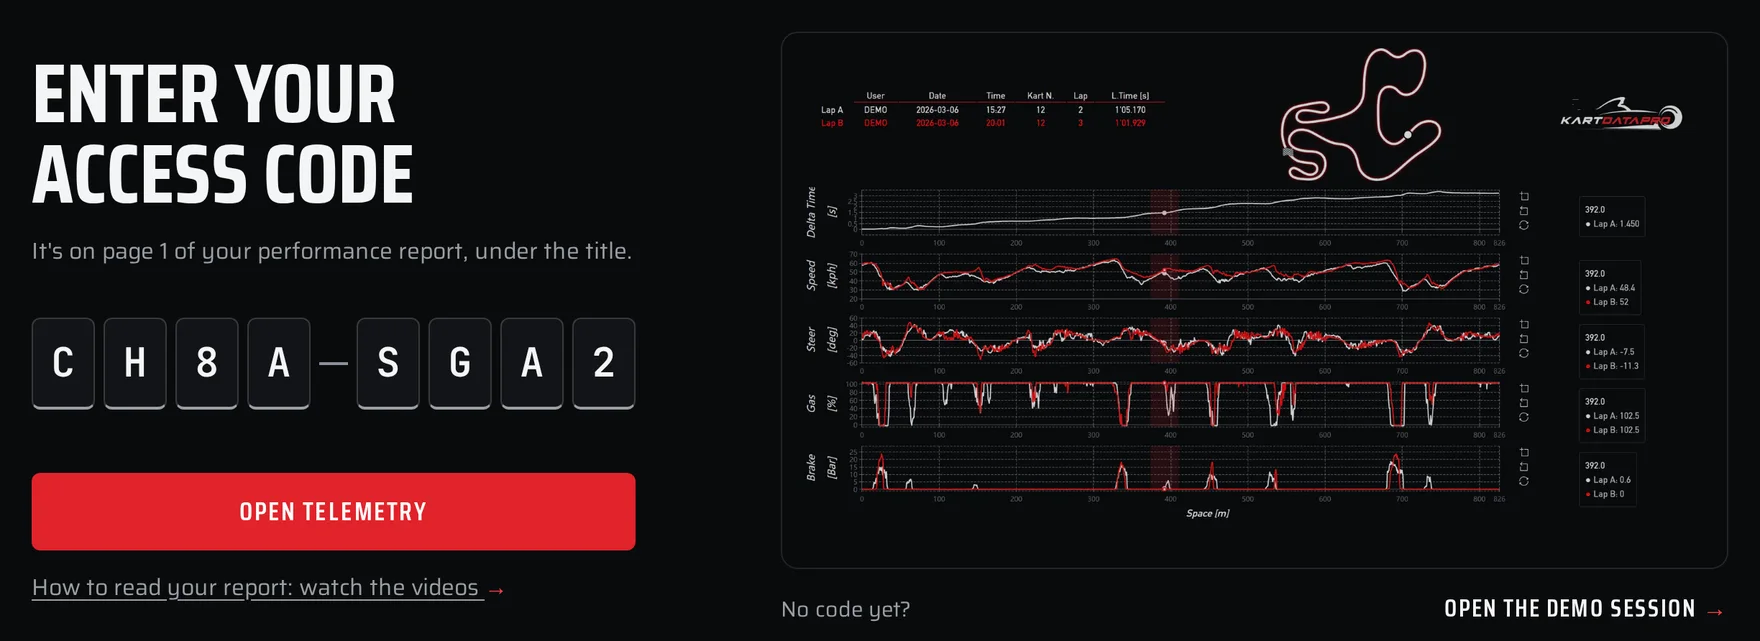
Under the title on page 1 is your quick access code: eight characters with a dash in the middle. Enter it at kartdatapro.com/data-point and the same two laps open in the analysis tool, with no account needed. The Open analysis tool button in the email does the same in one tap.
What are Lap A and Lap B?
Every report compares two laps:
- Lap A is your fastest lap of the session.
- Lap B is the reference: normally the fastest lap on the same layout in the last 365 days, by any driver. Staff can pick another lap instead, such as a friend’s, so you can race each other’s laps.
Page 1: both laps at a glance
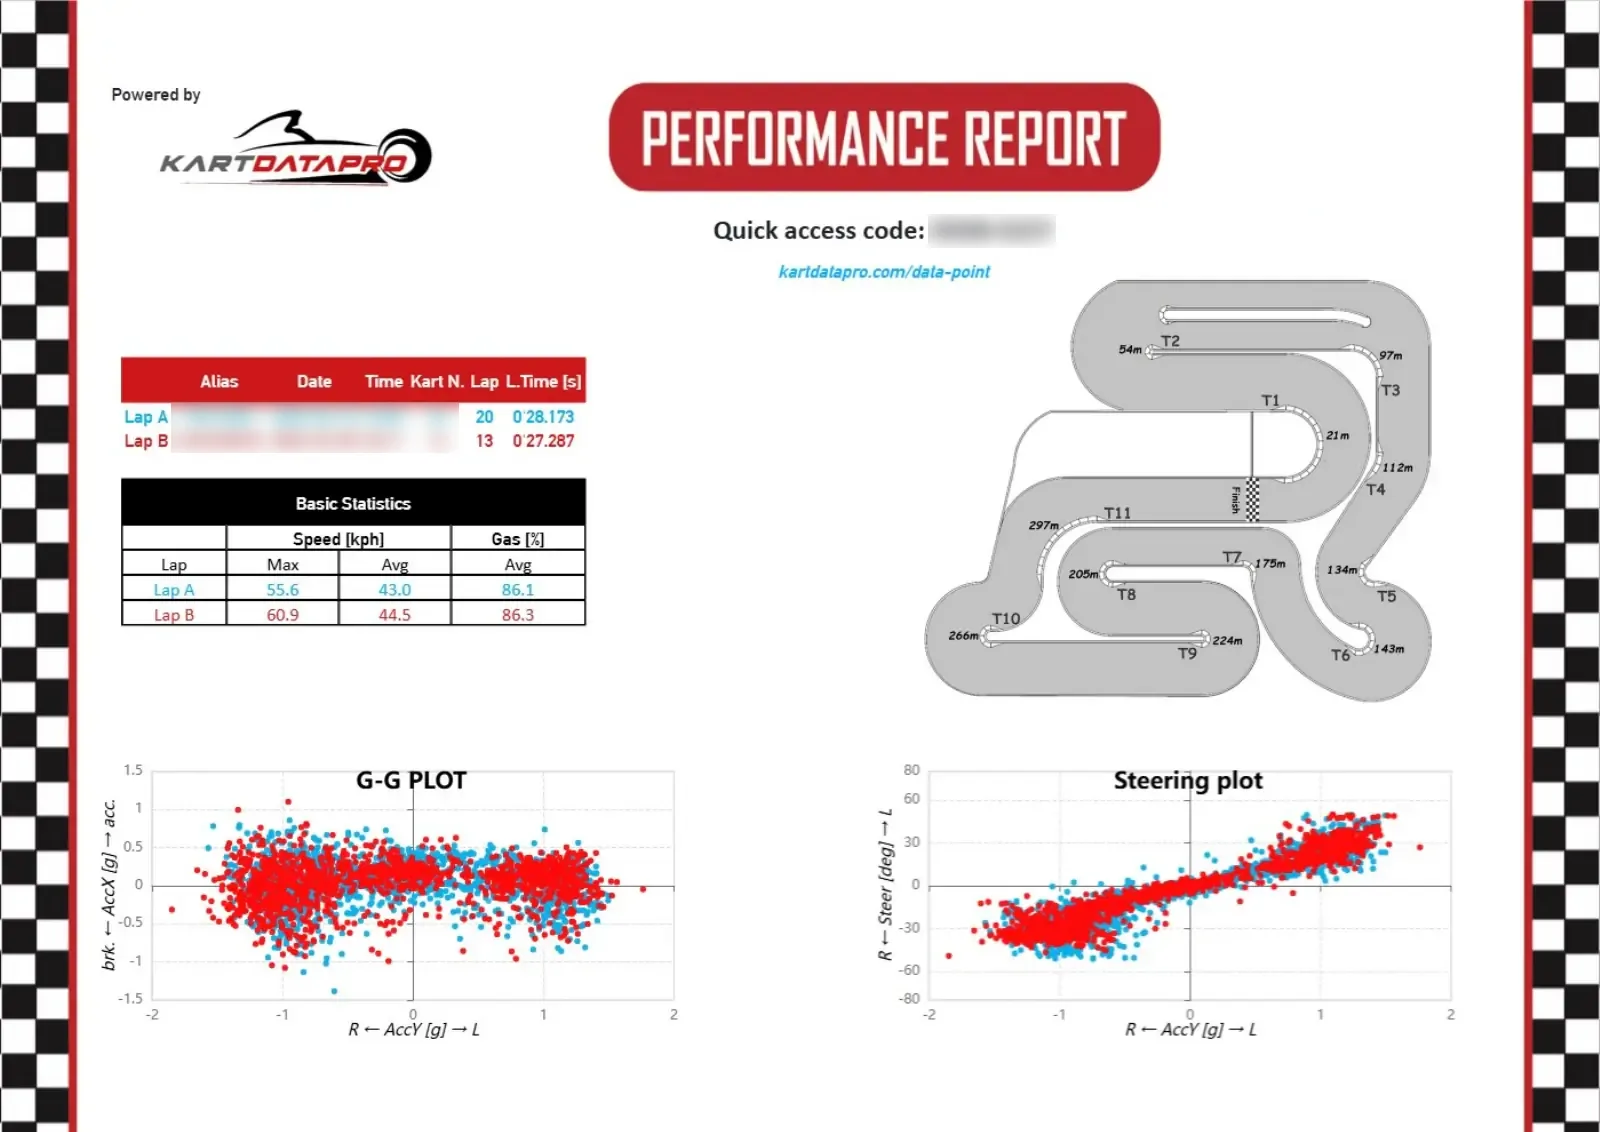
The lap table lists both laps: the driver’s alias, the date and time of day, the kart number, the lap number and the lap time.
Basic Statistics gives three numbers per lap:
- Speed, Max: the highest speed on the lap, in km/h.
- Speed, Avg: your average speed over the lap, in km/h.
- Gas, Avg: the average throttle position, in %. Gas is the throttle pedal: 0 % is foot off, 100 % is flat out.
These are whole-lap averages, so they hide where the difference happens. A similar top speed with a lower average speed often points to the corners rather than the straights.
The track map shows the layout, with the corners labelled T1, T2 and so on and their distance from the line in metres. Page 3 uses the same names, so the map is the key to the advice.
The G-G plot draws every moment of both laps as a dot. Up is acceleration and down is braking; left and right is the sideways force in a corner. Both are in g: at 1 g the push equals your own weight. Where Lap B’s dots reach further out than yours, that driver braked or cornered harder.
The steering plot puts steering angle against sideways force. Normally the dots form a diagonal band: more steering, more cornering force. Dots far from the band show steering that did not turn into force, which can point to the kart sliding.
What is delta time on a kart telemetry report?
Page 2 has five charts, and all of them share one horizontal axis: distance along the lap, in metres. In the PDF, Lap A is drawn in blue and Lap B in red, and both lap times are printed at the top.
The first chart is Delta Time [s]. In karting, delta time is the running gap between the two laps, metre by metre: Lap A’s time minus Lap B’s. Where the line rises, Lap A is losing time; where it falls, Lap A is gaining; where it is flat, the two are level.
Here is the delta for the two laps of the KartDataPro demo report.
Delta time: Lap A against Lap B
Gap in seconds (top) and speed in km/h (bottom), by distance around the lap
Your lapTrack best
528–568 m: +0.43 s
Show the chart as a table
| Distance (m) | Gap (s) | Your lap (km/h) | Track best (km/h) |
|---|---|---|---|
| 3 | +0.00 s | 58.5 km/h | 59.0 km/h |
| 200 | +0.70 s | 49.5 km/h | 49.8 km/h |
| 400 | +1.53 s | 42.9 km/h | 52.5 km/h |
| 528 | +2.27 s | 48.4 km/h | 55.6 km/h |
| 568 | +2.70 s | 40.8 km/h | 45.6 km/h |
| 600 | +2.74 s | 51.9 km/h | 50.1 km/h |
| 800 | +3.18 s | 53.7 km/h | 54.0 km/h |
The line climbs fastest through the shaded band, where Lap A’s speed trace sits below Lap B’s. The delta shows where the time goes; the other charts on page 2 show why.
Page 2: which channels explain the time loss?
The other four charts are, in order, Speed [kph], Steer [deg], Gas [%] and Brake [Bar]. Find the steepest climbs on the delta chart, then read straight down at those distances.
- Speed.
- Your line drops earlier before a corner: you braked earlier.
- It reaches a lower minimum: you slowed more than Lap B.
- It climbs later after the corner: you were back on the throttle later.
- Steer. Steering angle in degrees, left and right of straight. Several corrections in one corner usually mean the kart was not settled.
- Gas. Compare where each lap returns to 100 % after a corner. A few metres here, at every corner, add up over a lap.
- Brake. Brake pressure in bar. Look at where braking starts, how hard it peaks and where it ends. A line that never quite returns to zero can mean your foot is resting on the pedal.
Here is the shaded stretch from the delta chart, with every channel read at the same metre.
The costly stretch, channel by channel
Both laps around the shaded stretch: time gap, speed, throttle, brake and steering by distance
Your lapTrack best
528–568 m: +0.43 s
Show the chart as a table
| Distance (m) | Gap (s) | Speed A (km/h) | Speed B (km/h) | Throttle A (%) | Throttle B (%) | Brake A (bar) | Brake B (bar) | Steering A (deg) | Steering B (deg) |
|---|---|---|---|---|---|---|---|---|---|
| 480 | +2.24 | 45.7 | 45.3 | 100.0 | 100.0 | 0.0 | 0.0 | 28.3 | 0.2 |
| 500 | +2.27 | 49.4 | 49.4 | 100.0 | 100.0 | 0.0 | 0.0 | 3.7 | 5.5 |
| 520 | +2.25 | 53.9 | 53.4 | 100.0 | 100.0 | 0.0 | 0.0 | 9.6 | 6.2 |
| 528 | +2.27 | 48.4 | 55.6 | 1.7 | 100.0 | 10.1 | 0.0 | 22.1 | 13.7 |
| 540 | +2.44 | 42.0 | 48.1 | 81.7 | 52.4 | 0.0 | 0.1 | 34.6 | 28.1 |
| 560 | +2.60 | 41.5 | 47.4 | 80.2 | 87.6 | 0.0 | 0.0 | -41.4 | -31.7 |
| 568 | +2.70 | 40.8 | 45.6 | 100.0 | 100.0 | 0.0 | 0.0 | -3.8 | -13.3 |
| 580 | +2.75 | 47.3 | 50.2 | 100.0 | 100.0 | 0.0 | 0.0 | 23.9 | 14.1 |
| 600 | +2.74 | 51.9 | 50.1 | 100.0 | 100.0 | 0.0 | 0.0 | 14.4 | 4.4 |
The brake row explains the gap. Lap A starts braking at about 523 m, Lap B at about 533 m, both peaking near 11 bar. Lap A then bottoms out at 38.7 km/h through the change of direction, against 43.7 km/h for Lap B.
The deduction: brake about 10 m later with the same pressure, and carry the extra 5 km/h through the change of direction.
The guide to karting telemetry explains each channel, with two laps stacked on the same distance axis.
Page 3: the AI race engineer’s advice
Page 3, headed Race Engineer Advice (by AI), is written by an AI race engineer that KartDataPro designed for this report. It works from the same numbers as the charts. Motorsport experts steered its development: they reviewed its advice on real laps, and their corrections now shape how it reads your data. It has three parts:
- Summary: both lap times, the gap and where most of it goes.
- Where You Lose Time: the two or three places that cost Lap A the most, named as on the track map. Each says what the data shows you did differently there.
- Recommendations: two or three things to try next session, each tied to a corner or a distance.
How do you improve your lap time with telemetry?
- On the delta chart, find the one stretch where the line climbs the most, and read speed, brake and throttle at that distance.
- Pick one change for that corner, such as braking a few metres later or getting back to full throttle sooner.
- After the session, open the new report and check whether the delta line climbs less on that stretch.
One change at a time is easier to feel on track, and easier to see in the next report.
Frequently asked questions
What is Lap B in a KartDataPro report?
The reference lap: normally the fastest lap on the same layout in the last 365 days, by any driver. Venue staff can also set a friend's lap as Lap B.
What does a good brake trace look like?
A firm, short peak that starts late and drops cleanly back to zero. A line that never returns to zero suggests your foot is resting on the pedal.
Which languages does the report come in?
English, Spanish and Italian, including the AI race engineer's advice on page 3.
How we measured
- Source
- KartDataPro data logger on a rental kart
- Example laps
- Indoor rental track, March 2026, the two anonymised laps of the public demo report
- Chart processing
- Both laps lined up by distance around the lap, as in the report
- Worked example
- Braking points, pressures and speeds read from the same aligned demo laps; braking starts where pressure first passes 1 bar