
On this page
In short
Kart telemetry is a metre-by-metre record of a lap: speed, throttle, brake and steering. Laid over a faster lap, it shows exactly where you lose time and what you did differently there.
A lap time is one number. Telemetry shows the whole lap, so you see which corner the time went in and whether braking, speed or throttle caused it.
Racing drivers buy their own data logger. KartDataPro, a telemetry system for rental karting, fits one to the venue’s own karts, so any driver gets this data from a normal session, with a report on their best lap.
What does a kart data logger record?
Each kart carries a compact KartDataPro logger. It combines a motion sensor, a brake pressure sensor and a speed sensor on one wheel, and turns their readings into the channels below.
The wheel sensor also measures distance: how many metres the kart is past the start line. Every reading is tied to that distance, so two laps line up at the same point on the track, corner by corner.
Which channels does kart telemetry show?
A channel is one measurement recorded over the whole lap. Your report shows four:
- Speed, in km/h.
- Throttle, in %: how far the pedal is pressed, from 0 to 100.
- Brake, in bar: the pressure in the brake line. More bar means harder braking.
- Steering, in degrees: how far the wheel is turned away from straight.
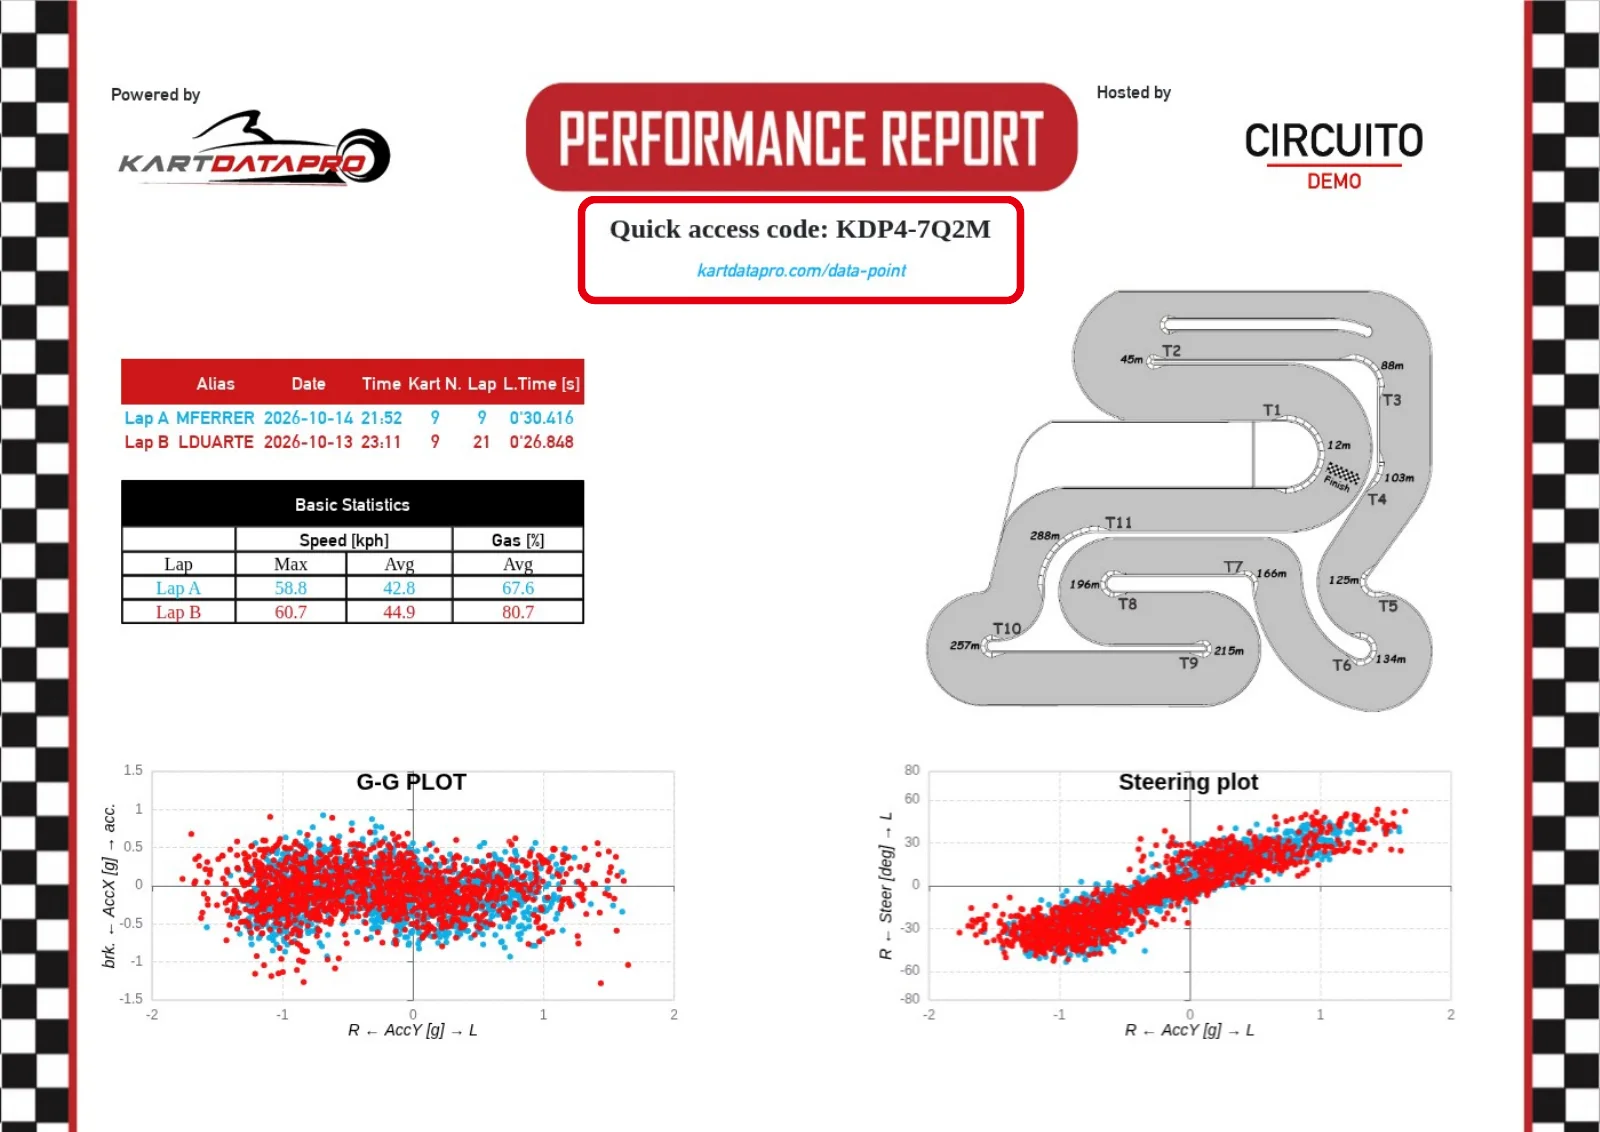
The motion sensor also records braking and cornering forces, which page 1 of the report plots as a G-G diagram.
Here is a real lap in white against the track best in red, with all four channels stacked on the same distance axis. The chart is zoomed in on the stretch that costs the most, and the Gap row on top shows the loss as it builds. Pick any point and read straight down to compare what the two drivers were doing at that metre.
Two laps, four channels
Zoomed in on the costliest stretch, shaded: time gap on top, then speed, throttle, brake and steering by distance
Your lapTrack best
528–568 m: +0.43 s
Show the chart as a table
| Distance (m) | Gap (s) | Speed A (km/h) | Speed B (km/h) | Throttle A (%) | Throttle B (%) | Brake A (bar) | Brake B (bar) | Steering A (deg) | Steering B (deg) |
|---|---|---|---|---|---|---|---|---|---|
| 480 | +2.24 | 45.7 | 45.3 | 100.0 | 100.0 | 0.0 | 0.0 | 28.3 | 0.2 |
| 500 | +2.27 | 49.4 | 49.4 | 100.0 | 100.0 | 0.0 | 0.0 | 3.7 | 5.5 |
| 520 | +2.25 | 53.9 | 53.4 | 100.0 | 100.0 | 0.0 | 0.0 | 9.6 | 6.2 |
| 528 | +2.27 | 48.4 | 55.6 | 1.7 | 100.0 | 10.1 | 0.0 | 22.1 | 13.7 |
| 540 | +2.44 | 42.0 | 48.1 | 81.7 | 52.4 | 0.0 | 0.1 | 34.6 | 28.1 |
| 560 | +2.60 | 41.5 | 47.4 | 80.2 | 87.6 | 0.0 | 0.0 | -41.4 | -31.7 |
| 568 | +2.70 | 40.8 | 45.6 | 100.0 | 100.0 | 0.0 | 0.0 | -3.8 | -13.3 |
| 580 | +2.75 | 47.3 | 50.2 | 100.0 | 100.0 | 0.0 | 0.0 | 23.9 | 14.1 |
| 600 | +2.74 | 51.9 | 50.1 | 100.0 | 100.0 | 0.0 | 0.0 | 14.4 | 4.4 |
What is delta time in karting?
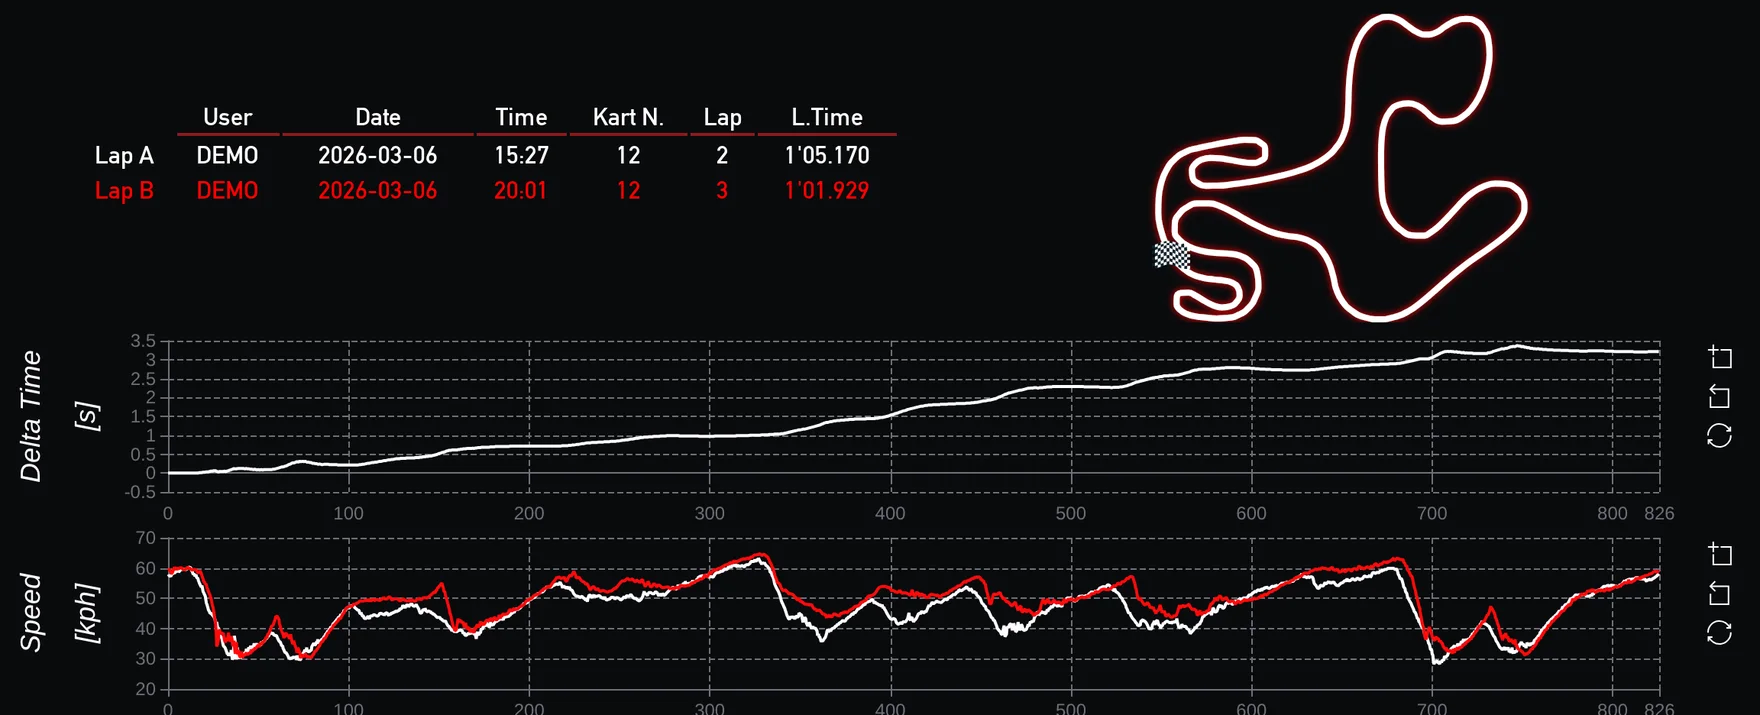
Your report compares two laps. Lap A is your best lap of the session. Lap B is the reference: normally the fastest lap on the same layout in the last 365 days, by any driver.
Delta time is the running time gap between your lap and a faster one, metre by metre. Where the line rises you are losing time, where it falls you are gaining. That is the Gap row in the chart above.
The delta tells you where to look, and the channels tell you what happened there. How to read your KartDataPro report shows the delta chart as it appears in your report, and works through this example step by step.
How do I open my own laps?
Under the title on page 1 of your report there is a quick access code. Enter it at kartdatapro.com/data-point and both laps open in the analysis tool, with no account needed.
No report yet? Click the screenshot below to open a demo session with the laps in the chart above.
Page 3 of the report is written by an AI race engineer. It sums up the gap, names the two or three places where you lose the most time and suggests what to try next session. How to read your KartDataPro report walks through every page.
Frequently asked questions
Do I need my own data logger?
No. At a KartDataPro venue the logger is already on the rental kart. You choose telemetry with your session and the report comes after it.
What does it mean when the delta line goes up?
You are losing time to the reference lap at that distance. The steeper the climb, the more time that stretch costs.
Can I see my laps online?
Yes. Enter the quick access code from page 1 of your report at kartdatapro.com/data-point and both laps open in the analysis tool, with no account needed.
How we measured
- Source
- KartDataPro data logger on a rental kart
- Example laps
- Indoor rental track, March 2026, the two anonymised laps of the public demo report
- Chart processing
- Both laps lined up by distance around the lap, as in the report
Open your own laps
Have a report? Enter its quick access code. No report yet? Open a demo session and explore a real lap.
Enter my codeTry the demo session